 The capital city of Slovak republic Bratislava


The capital city of Slovak republic Bratislava
Web applications enable quick visualization of various types of spatial data on the territory of Bratislava, eventually the whole country. They can include different types of data, which describe spatial phenomena in the form of points, lines or planes, for example, the share of inhabitants in a grid or the number of housing units. To ensure clarity, spatial data can be visualised on a number of different basemaps. The main characteristics of such application are openness, timeliness, user-friendliness and interpretive clarity.
Recommended Bratislava map applications
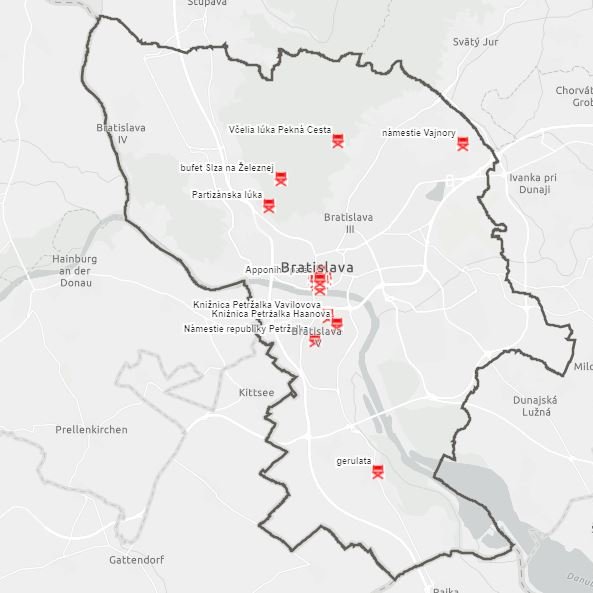
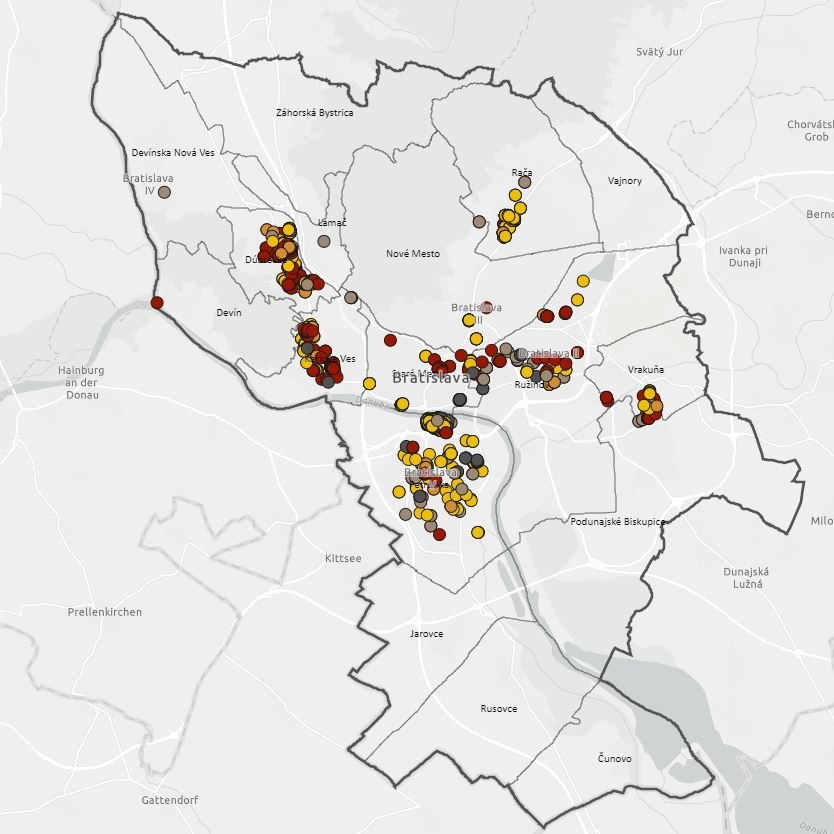
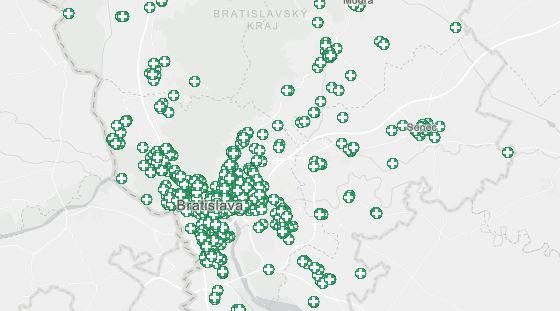
Number of Violations in Bratislava in 2021
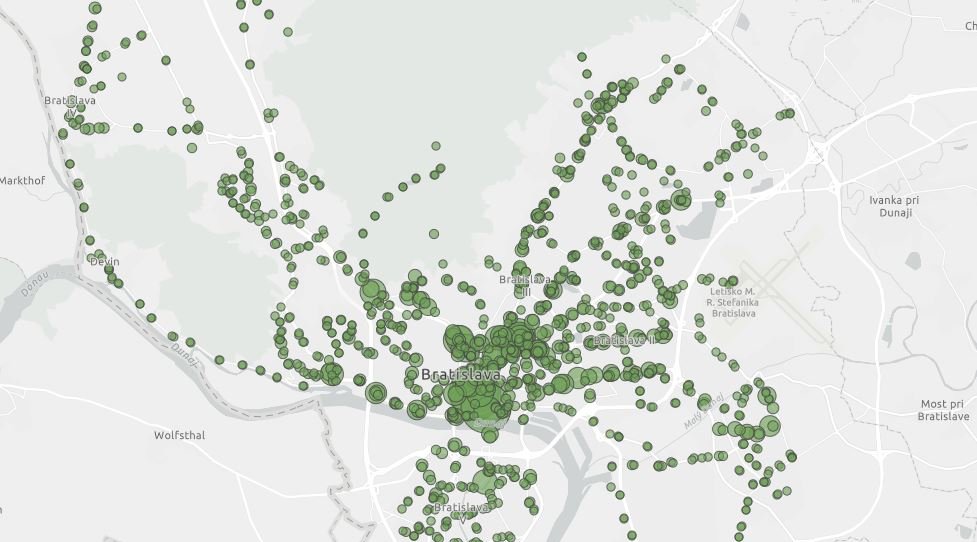
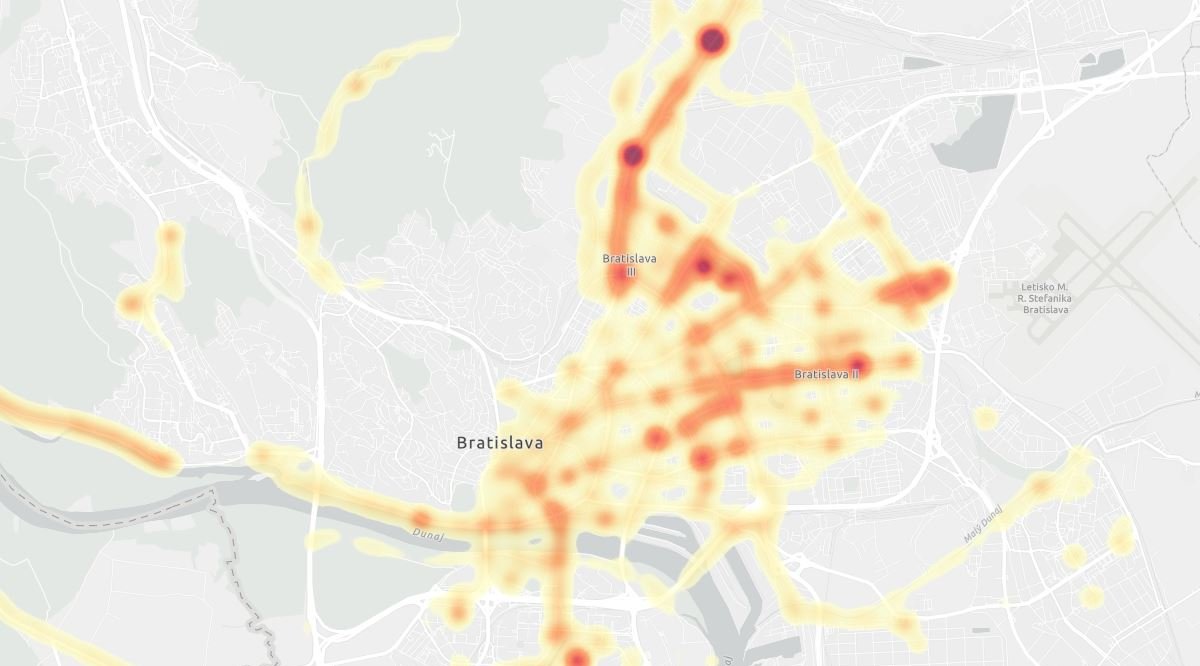
The average number of board per hour at Bratislava Public Transport Stops in 2019
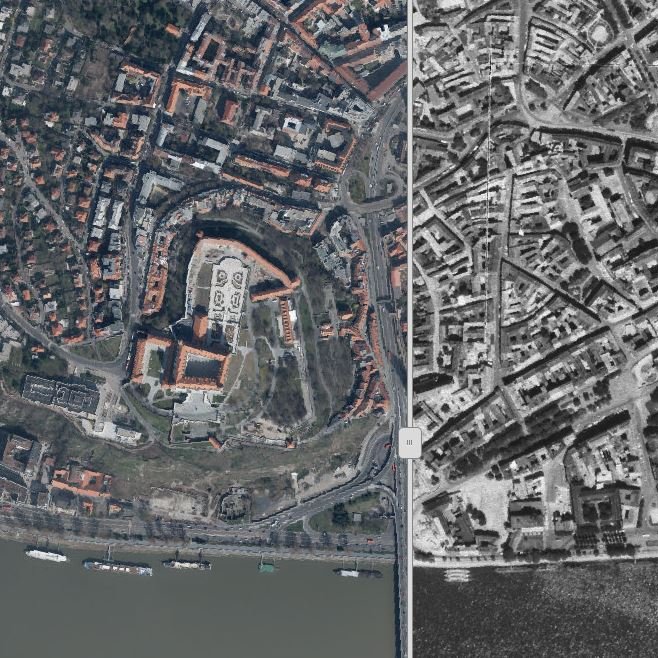
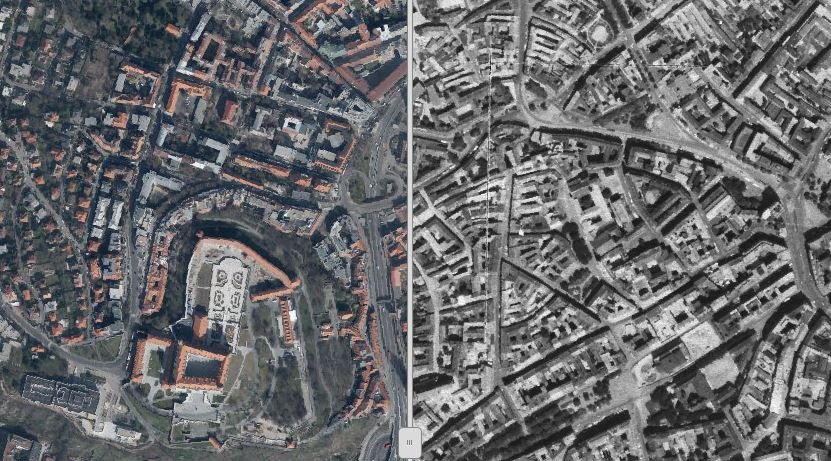
Two faces of Bratislava - year 1969 - 2019
Sit down!
Clipping or wood nutros
Advertising in Bratislava
Recent Bratislava map applications
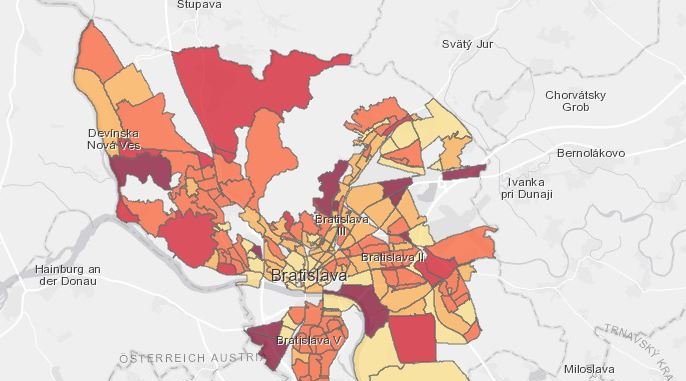
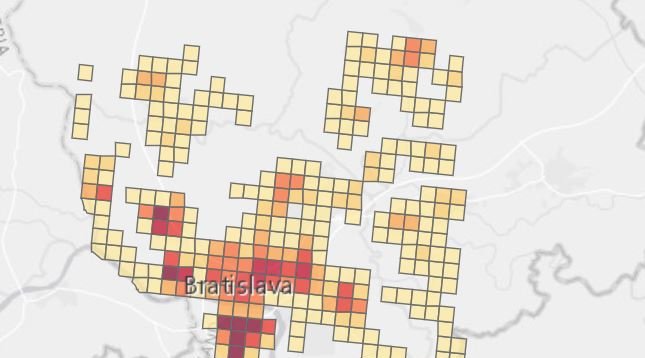
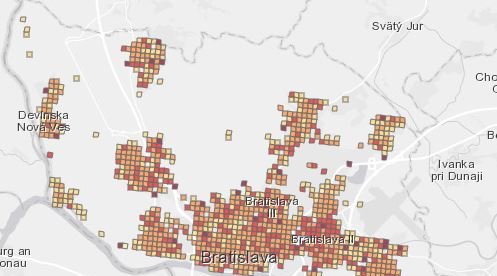
The application displays the number of violations in the city of Bratislava according to the streets where the violations was committed. After clicking on the selected street, the number of committed violations will be displayed. Violations are listed by default according to groups and types of violations. In the application you will find violations divided by " Road safety and traffic flow" and "except Road safety and traffic flow". Data are processed for the year 2021. Source: Municipal Police of the Capital of the Slovak Republic, Bratislava You can find more information directly in the application.
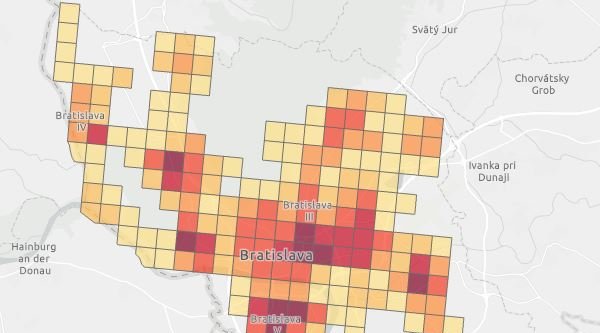
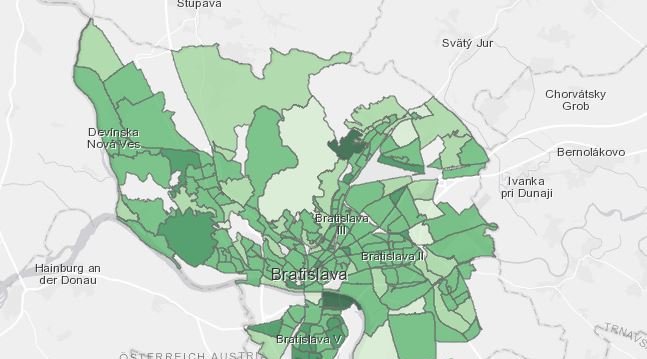
Number of Residents 18 Years of Age or Older in Grid 1x1 Kilometer in Bratislava in September 2021
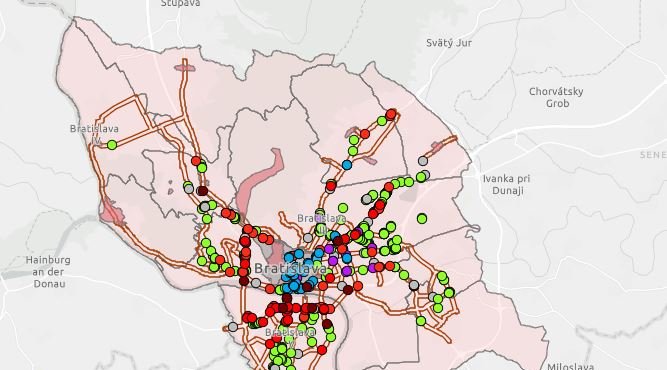
Pharmacies, Doctors and Medical Equipment in Bratislava Region in January 2021
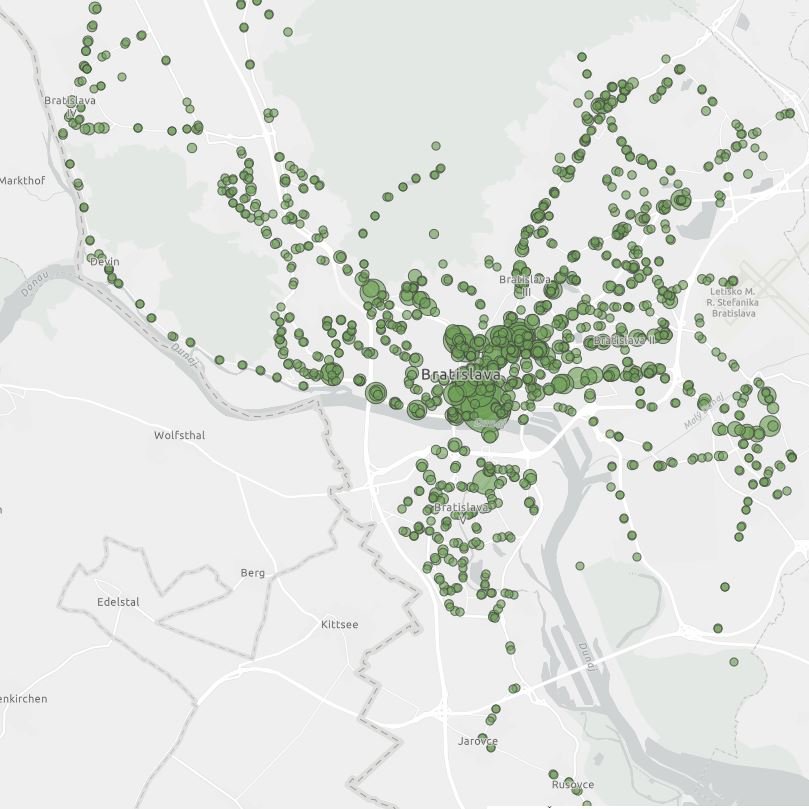
The average number of board per hour at Bratislava Public Transport Stops in november 2019
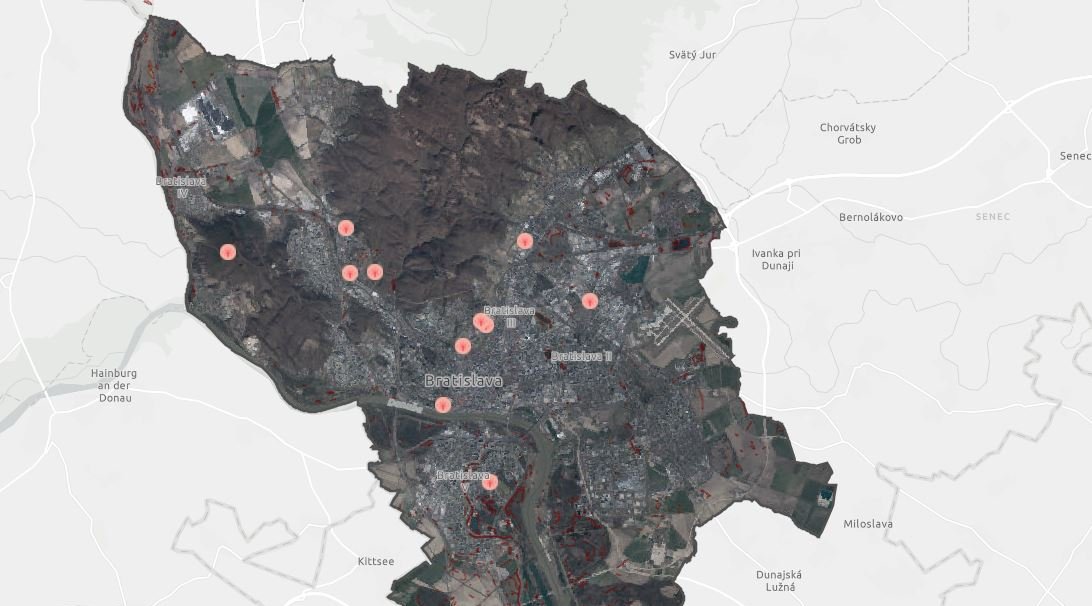
Map application composed of individual orthophotographs depicting Bratislava city since 1969 until 2019.
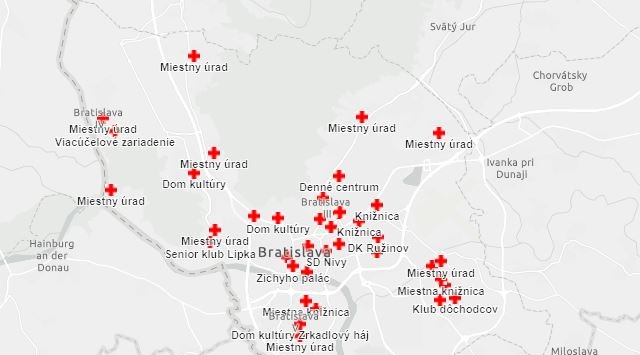
Districted Census in Bratislava started May 3 and end on June 13. If you didn't get online, you can call a home assistant in this period or you can come to the contact point and add. If you decide for the first variant, order a home assistant, you can do so at the city section or on CallCentre statistics: +421 2 20 92 49 19. Then your urban part sends an assistant directly to your home. The assistant will also be equipped with a license and you can verify its identity on your urban part. But you can also walk. The city parts have created contact points where an assistant expects you and will help you to add. All places are published on the website of the statistics here: https://www.scitani.sk/Scitania-vatelov/asistování-Scitania and Bratislava shown in this map. This form is designed for seniors or people who did not know or could not add in February and March. This form is safe and you don't have to worry about. Assistants are also professionally technically prepared to help you so you can also show you in Bratislava. In the first phase, we have added 86%, which was perfect and now we have to make it gonna go and enjoy the missing 14% so that we show us really half a million. They're just the last weeks, so do not hesitate to engage - Don't wait. For your census come to Bratislava millions €, which will be used for more modern public transport, better paths, more nurseries or places for seniors, more trees or more beautiful, more prettier and cleaner public spaces.
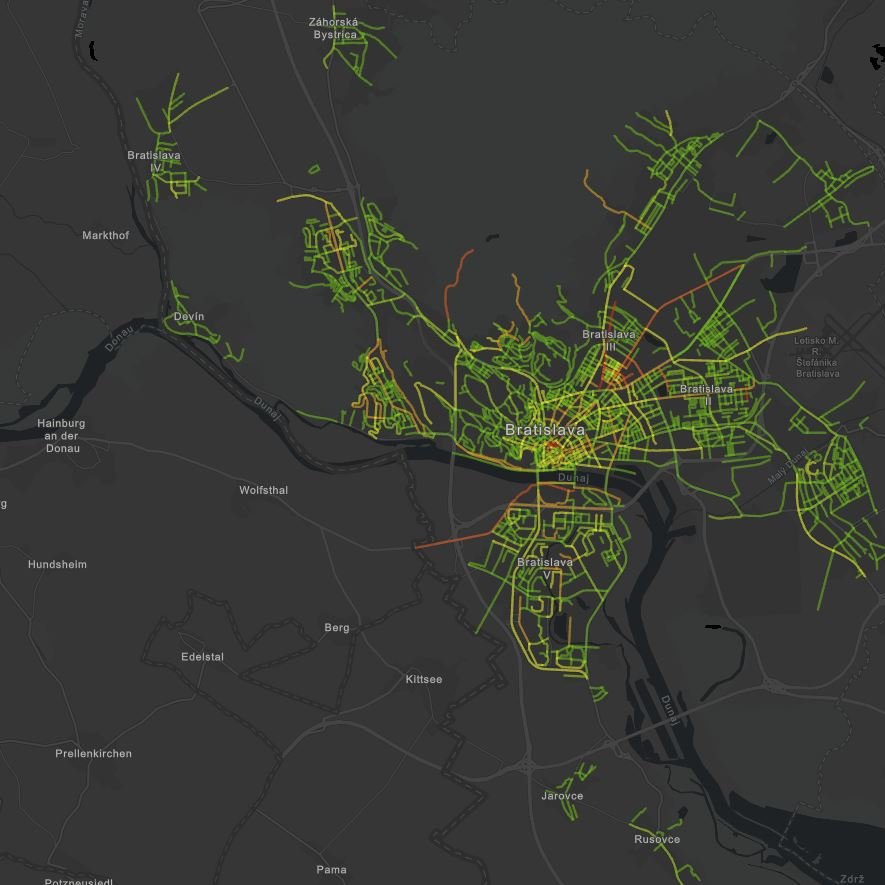
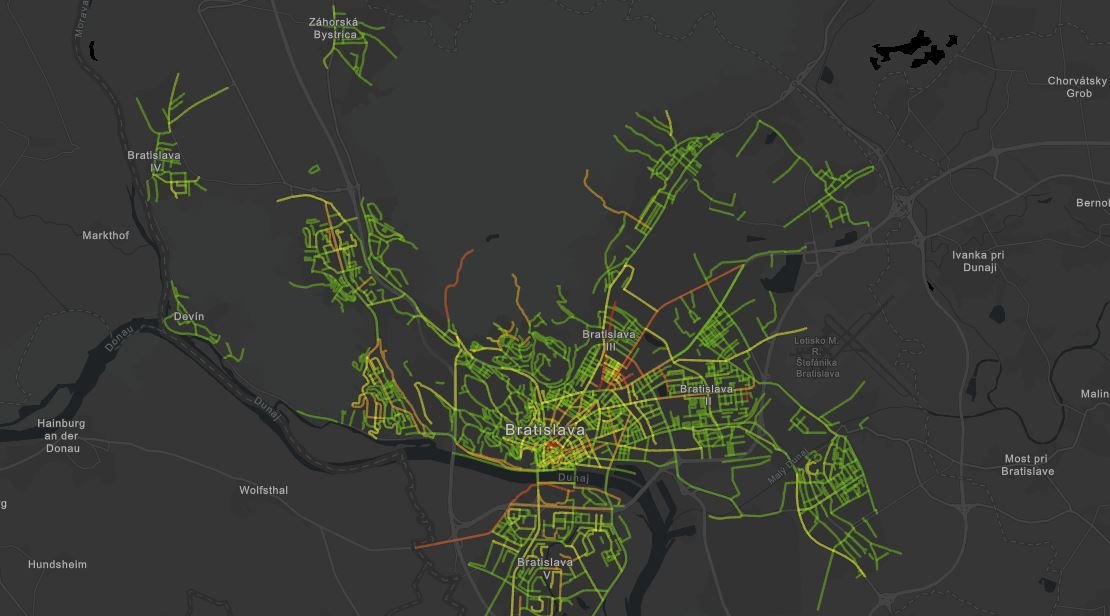
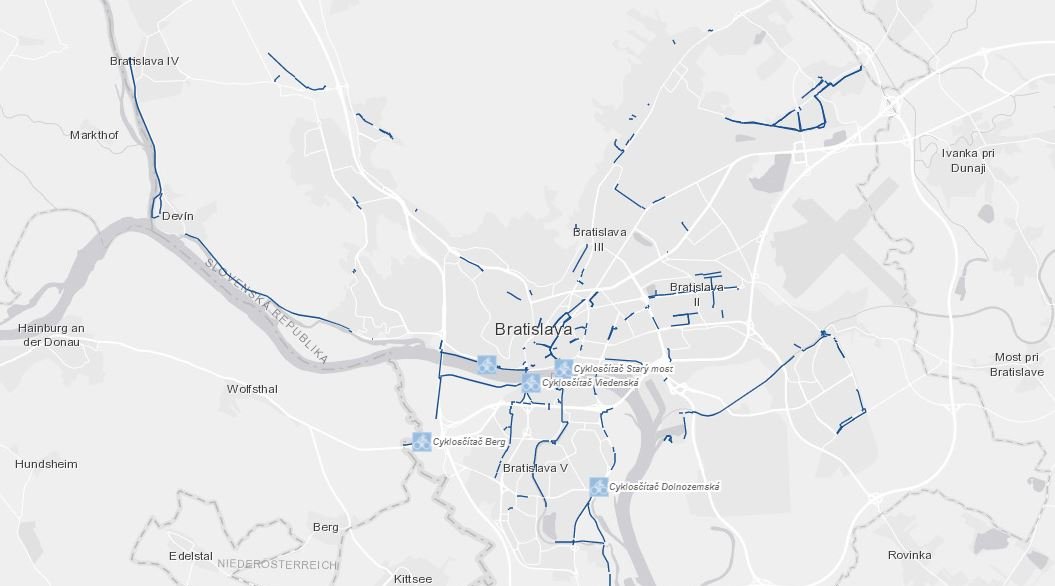
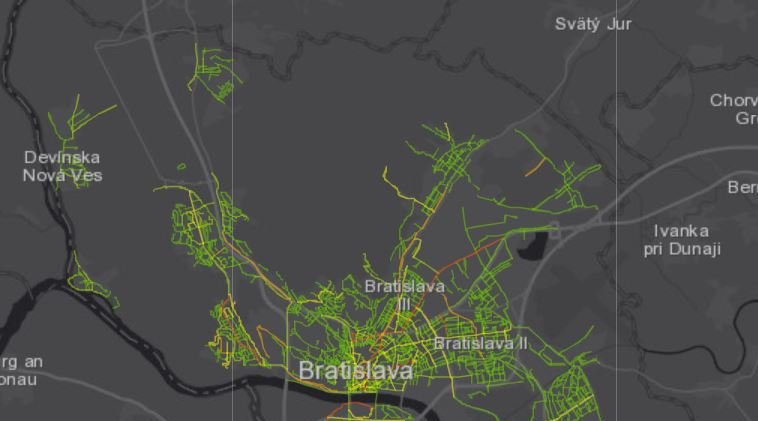
The map of cycling routes in Bratislava shows the official cycling routes in the Capital of the Slovak Republic. Cyclists in Bratislava can use overall 55 cycling routes with a total length of almost 100 km. After clicking on a specific cycling route in the map below, a more detailed description will be displayed. This contains the official number of the cycling route, its color marking, and length in meters. The data are based on OpenStreetMap data and on supplements marked by Cyklokoalícia organization
Project Sit down! brings free public sitting in Bratislava - red tables and chairs that revive and cultivate seafearing spaces. Move the chair into the shadow if there is a hot day or the sun if it is cool morning. (https://mib.sk/projekt/sadni-si/)
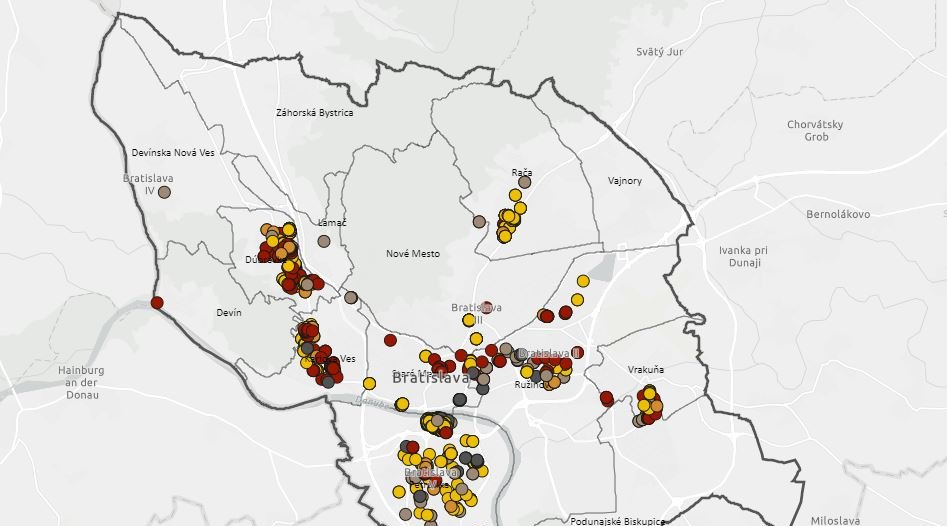
Clipping or wood nutros in Bratislava recorded from Spring in 2020. The map is regularly updated according to other performed or planned clipping or wood nutros.
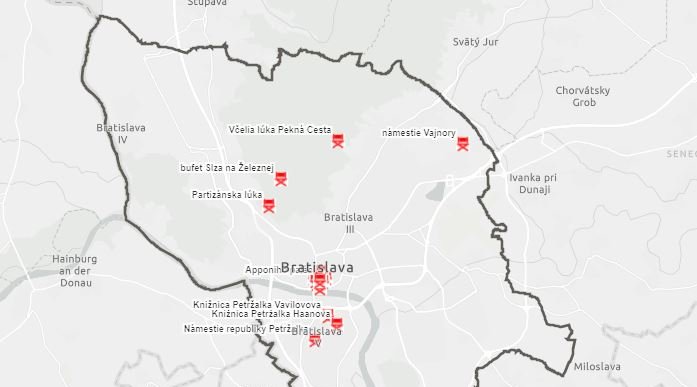
Will it be fleeing in the sweeth larvae? Mark this mosquito hatchery on the map. After marking a place, describe or add a photo to know the hatching in the field quickly identify. Our training workers check this hatchness and if it is evaluated as risky and we will carry out the intervention with BTI. Thank you for your observation to contribute to happier summer.
Data use: Setting up better and more efficient provision of information to the inhabitants of the city and communication of the city and its districts with the inhabitants regarding various communication channels, better city services and their accessibility to inhabitants (Census 2011)
Data use: Better city services and their accessibility to inhabitants, setting up better and more efficient provision of information to inhabitants and communication of the city and its districts with inhabitants in several languages (Census 2011)
Data use: Better city services and their accessibility to inhabitants, setting up better and more efficient provision of information to inhabitants and communication of the city and its districts with inhabitants in several languages (Census 2011)
Data use: More efficient setting of the city´s parking and waste policies, collection of taxes and fees and their investment in the city services and events for citizens (Census 2011)
Data use: Better city services and their accessibility to inhabitants, investment in public transport infrastructure, planning the development of multistory car parks (Census 2011)
ABB Advertising in Bratislava
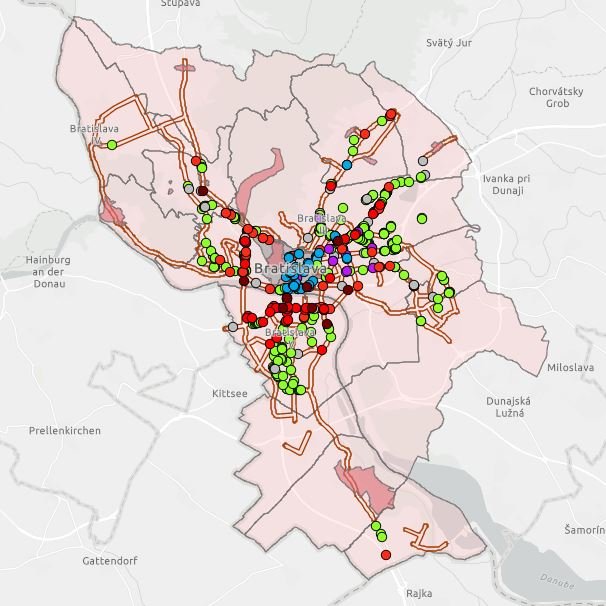
The application shows all rides of SlovnaftBAjk shared bikes in the week from 11.-17.8.2020. We can also see docking stations and bike paths, which are located in the city (until 2018). More information can be found at: https://slovnaftbajk.sk
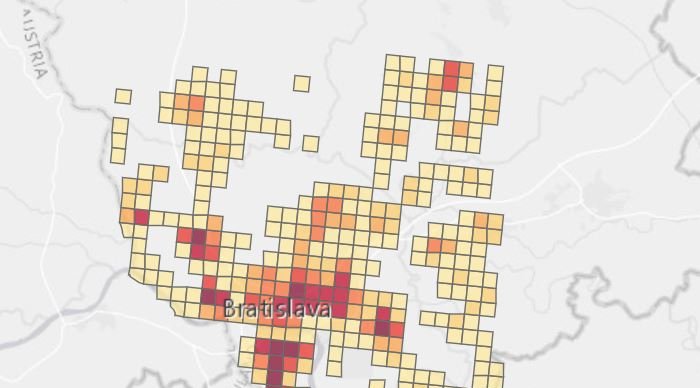
The application displays the number of violations in the city of Bratislava according to the streets where the violations was committed. After clicking on the selected street, the number of committed violations will be displayed. Violations are listed by default according to groups and types of violations. In the application you will find violations divided by " Road safety and traffic flow" and "except Road safety and traffic flow". Data are processed for the year 2020 (January-September). Source: Municipal Police of the Capital of the Slovak Republic, Bratislava You can find more information directly in the application.
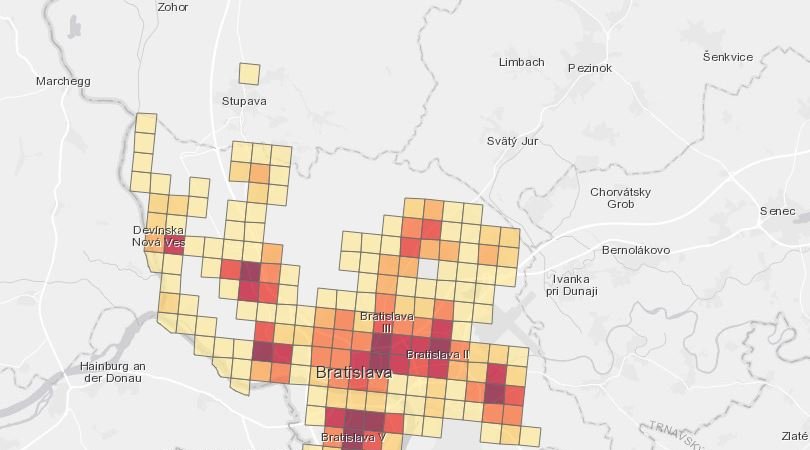
Visualization displays data on the number of economically active and economically inactive inhabitants in the given location of Bratislava. The source of data is the Statistical Office of the Slovak Republic - Census of Population, Housing and Dwellings 2011. Data current as of 21.05.2011.
Visualization displays data on the number of employed inhabitants in the given location of Bratislava. The source of data is the Statistical Office of the Slovak Republic - Census of Population, Housing and Dwellings 2011. Data current as of 21.05.2011
Number of inhabitants in the given location of Bratislava, according to their highest achieved level of education - Census of Population, Housing and Dwellings 2011.
Visualization displays data on the number of inhabitants in the given location of Bratislava, according to their economic status, age and gender. The source of data is the Statistical Office of the Slovak Republic - Census of Population, Housing and Dwellings 2011. Data current as of 21.05.2011
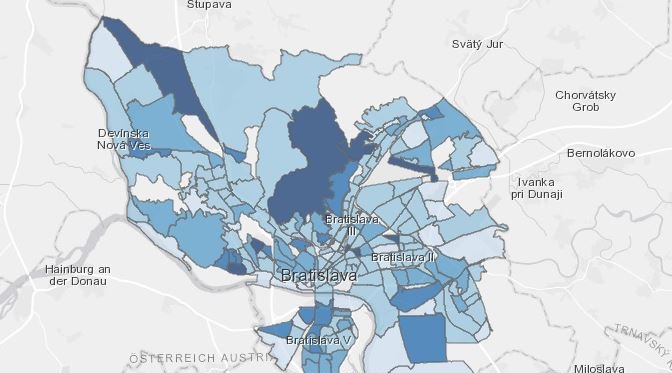
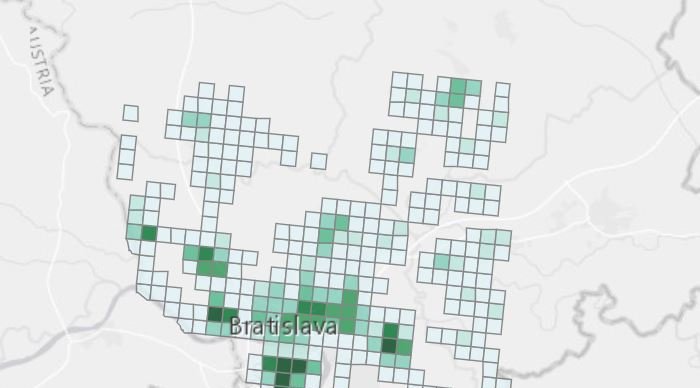
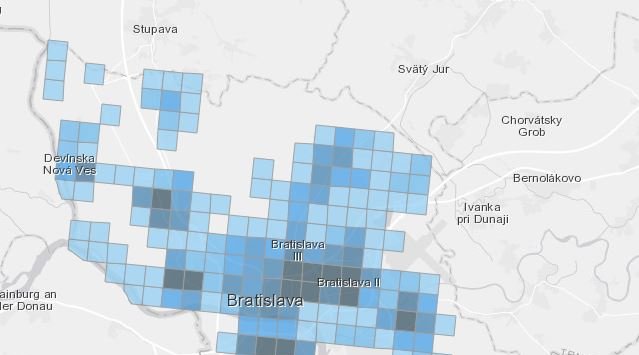
Spatial distribution of the population is normally expressed using discrete objects (boundaries of administrative or statistical territorial units) to which data on the number of residents are aggregated. However, this way of presentation is often insufficient for analytical purposes. The main drawbacks include the omission of natural conditions and possible modification of borders, which can statistically significantly affect the results of spatial data analyses. Since the distribution of residential households and knowledge about their spatial differentiation is needed for many areas of human activity (traffic planning, land use planning), the City of Bratislava created, for the first time, a raster visualisation of the number of dwellings, using a dataset containing grids for each individual EU country. Grid with the size of 1km x 1km has been used for Bratislava. Within the visualization, (estimated) data on the number of dwellings in apartment and family houses is shown. The number of dwellings in a family house is estimated as 1, as more specific information is not available in the source data. The source of the data for estimation is the Geodesy, Cartography and Cadastre Authority of the Slovak Republic.
Spatial distribution of the population is normally expressed using discrete objects (boundaries of administrative or statistical territorial units) to which data on the number of residents are aggregated. However, this way of presentation is often insufficient for analytical purposes. The main drawbacks include the omission of natural conditions and possible modification of borders, which can statistically significantly affect the results of spatial data analyses. Since the distribution of residential households and knowledge about their spatial differentiation is needed for many areas of human activity (traffic planning, land use planning), the City of Bratislava created, for the first time, a raster visualisation of the number of dwellings, using a dataset containing grids for each individual EU country. Grid with the size of 1km x 1km has been used for Bratislava. Within the visualization, (estimated) data on the number of dwellings in apartment and family houses is shown. The number of dwellings in a family house is estimated as 1, as more specific information is not available in the source data. The source of the data for estimation is the Geodesy, Cartography and Cadastre Authority of the Slovak Republic.
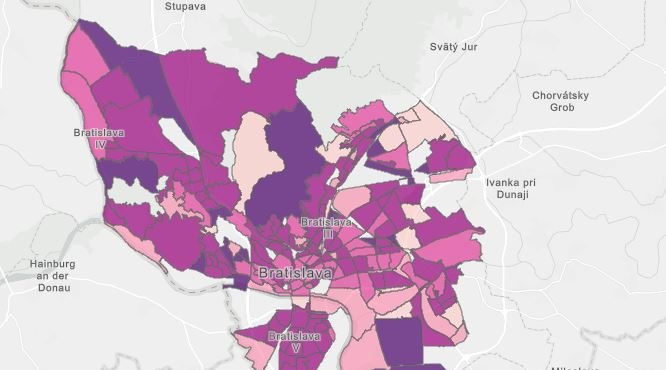
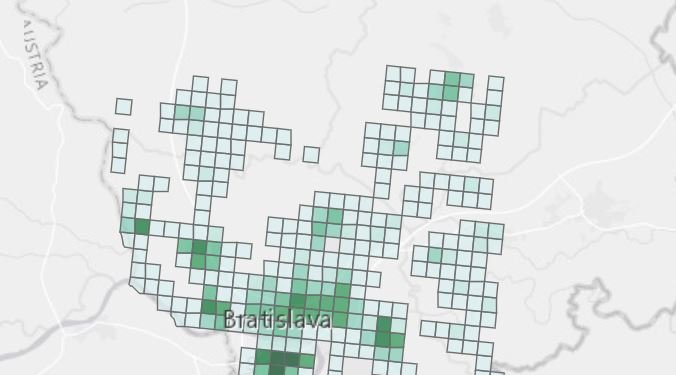
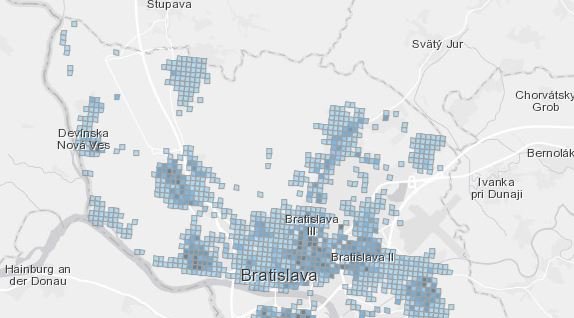
Spatial distribution of the population is normally processed by discrete objects (boundaries of administrative or statistical territorial units) to which data on number of population are aggregated. However, this way of presentation is often insufficient for analytical purposes. The main drawbacks include the omission of natural conditions and possible modification of borders, which can statistically significantly affect results of spatial data analyses. Since the distribution of the population is one of the basic socio-economic variables, and knowledge of its spatial differentiation is needed for many areas of human activity, the Statistical Office of the Slovak Republic created, for the first time, a raster database of the numbers of population by basic demographic structures (gender, age), using a dataset of networks containing grids for each individual EU country. For Bratislava dataset with size of 250x250 m has been used. Within visualization data (estimation) of permanent population of Bratislava by economic age groups and sex are visualized. Source of data for estimation is Ministry of interior of the Slovak republic. Shares are processed as share in every single age group on overall permanent population in grid. Within data processing, grids with small number of population has been anonymized.
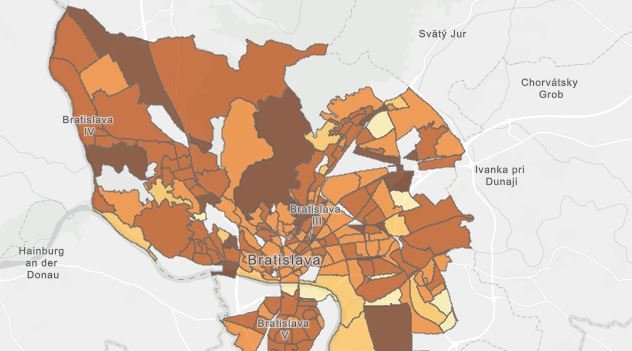
Spatial distribution of the population is normally expressed using discrete objects (boundaries of administrative or statistical territorial units) to which data on the number of residents are aggregated. However, this way of presentation is often insufficient for analytical purposes. The main drawbacks include the omission of natural conditions and possible modification of borders, which can statistically significantly affect the results of spatial data analyses. Since population distribution is one of the basic socio-economic variables, and knowledge of its spatial differentiation is needed for many areas of human activity, the City of Bratislava created, for the first time, a raster visualisation of the number of residents by basic demographic structures (gender, age), using a dataset containing grids for each individual EU country. Grid with the size of 1km x 1km has been used for Bratislava. Within the visualization, (estimated) data on population with a permanent residency of Bratislava by economic age groups and sex is shown. The source of the data for estimation is the Ministry of Interior of the Slovak republic.
Newest datasets
Newest PowerBI
Newest MapsBA
Open data are information or data freely available for everyone under equal conditions, which can be used for any purpose, commercial or noncommercial. They are available on the internet in structured form, which allows machine processing. The aim of the portal www.opendata.bratislva.sk is to support open data of Bratislava City.